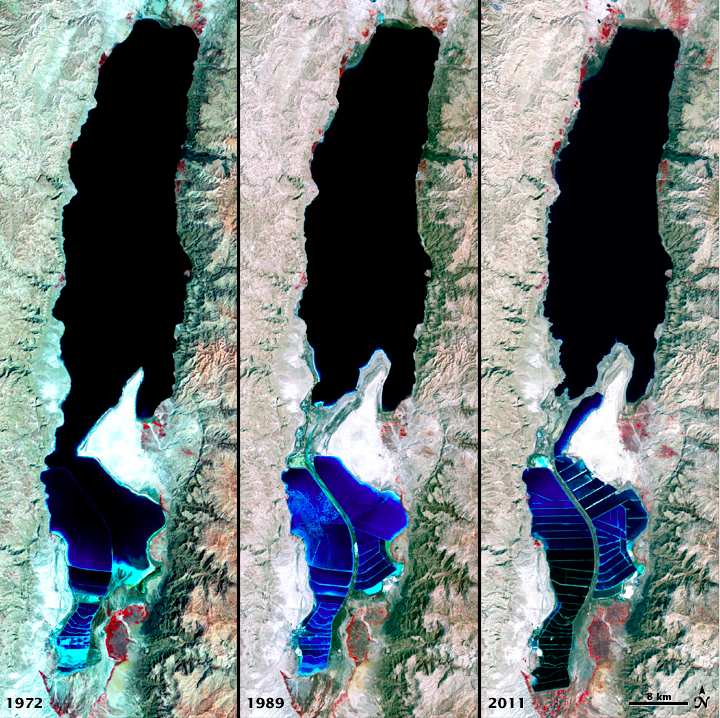
The Dead Sea is less than an hour drive from Jerusalem so it’s an area that I guide often. I always point out the two black lines on the rocks to the right of the highway across from Ein Feshka, the levels of the sea as recorded by the Palestine Exploration Fund in the 1920s and explain that the Dead Sea is shrinking by a meter a year. I usually get asked how the Dead Sea has changed over time. These satellite photographs from Nasa’s Earth Observatory website show it clearly.
The false-color images above were captured by the Landsat 1, 4, and 7 satellites on September 15, 1972, August 27, 1989 and October 11, 2011.
All three images include a combination of near-infrared, red, and green wavelengths. Deep waters are blue or dark blue, while brighter blues indicate shallow waters or salt ponds (in the south). The pale pink and sand-colored regions are barren desert landscapes, while green indicates sparsely vegetated lands. Denser vegetation appears bright red. Near the center is the Lisan Peninsula, which forms a land bridge through the Dead Sea.
For more information about the Dead Sea check out my blog post here.

Pingback: Earthquakes in History and Archaeology | Israel Tour Guide
Pingback: Site Map | Israel Tours | Israel Tour Guide
Rain, hail and snow that pummeled Israel earlier this month has led to the Dead Sea rising by 10 cm, the first recorded increase in volume in a decade.
Pingback: Photo of the Week – Dead Sea Works Moonrise | Israel Tours | Israel Tour Guide
Pingback: Nebi Musa | Israel Tour Guide | Israel Tours
Pingback: Through My Lens, Dead Sea | Israel Tour Guide | Israel Tours
Pingback: Through the Lens, Dead Sea | Israel Tours